
Reverse proxy reporting (using WebSpy Vantage Ultimate) is a great way to gain insight to how the Internet is using your published web sites or web applications.
Forward proxy reporting is all about the users accessing content on the Internet from within your corporate network. Reverse proxy reporting is the opposite. When you have a web site that is hosted on your internal or DMZ network and you publish it to the Internet through a device like Microsoft Forefront TMG or Sophos UTM’s Web Application Firewall feature then you have a reverse proxy scenario.
Proxy Logs vs Web Analytics Apps
One question that often comes up is why should one use reverse proxy logs to analyse a site’s usage rather than something like Google Analytics. There are numerous reasons, but if your published application or business application is not simply a public website the following are the most important reasons:
- Proxy logs show you what is really happening, first-hand
- No need to include any external content or javascript on your site to collect the information you require
- The site remains single source
- The site remains completely private
- You get a holistic picture of multiple sites on the same network
Sounds good, how do I set up Reverse Proxy Reports?
This guide will step you through the basics to get going. We always recommend working with a small manageable dataset to speed up the development of filters, templates and reports. If you are following along, we suggest importing a single log file or a limited amount of files. That said, if the sample is too small you might not get good visibility, but if it’s too big it will slow down your testing.
Filter by Source Network
Some environments are fortunate enough to have a separate or discreet forward and reverse proxy setup. That is, the forward proxy and the reverse proxy are not on the same device, such as a single Microsoft Forefront TMG Server instance. Even if your environment is consolidated, having both the forward and reverse proxy on the same device, you can still make use of this guide. The key is knowing how to filter by source network.
Reverse proxy traffic always has the Internet as the source. In Microsoft Forefront TMG, that is defined as the External Network. By isolating traffic that was initiated on the External Network you eliminate other sources of traffic such as internal, DMZ or VPN.
Since you would generally be running very different reports for forward and reverse proxy traffic, it makes sense to create a separate Storage in WebSpy Vantage for reverse proxy reporting. Specifying the source network in an Import Filter makes sure that your Storage only contains the reverse proxy log data, which makes further filtering and analysis simpler and faster.
Create a Storage and import your log files
Your raw log files need to be imported into a Storage, which will act as a “database” against which the reports will be generated.
- Open WebSpy Vantage Ultimate, and select the Storages tab
- On the left-hand side click New Storage
- Specify a Name and click OK, then Next
- Input Type: Local or networked files or folders
- Loader Selection: Pick your proxy type (Microsoft FTMG in my case), then click Next
- Input Selection: Click Add and specify the path to a log file or folder of log files
- Filters: Select the Forefront TMG Web tab and click Add for a new Filter
- For the Summary select Source Network, and select the Include option (note – The Source Network field is a field unique to Microsoft Forefront TMG. For other reverse proxy formats, you might like to use Source Address summary together with the Subnets Alias)
- Click Add Type External as the value.
- Click OK twice to return to the Import Wizard
- Click OK to complete the wizard and start importing your log files.

Summary analysis
Once your (filtered) log data has been imported you can have a look to see if everything is as you expect it to be. The Summary Analysis in Ad-hoc mode will also show you what log data is available for use in generating templates and reports.
- From the WebSpy Vantage console select the Summaries tab
- Click New Analysis
- Select your Reverse Proxy Storage created earlier and click Next
- Select the Ad-hoc Analysis Type and click OK (you can ignore the filters and summaries tab)
To verify that the import filter was successful check the Source Network node and confirm that only External is listed.
Identifying your published web sites
Using the same ad-hoc Summary Analysis, check the Rule node and verify that your “publishing rules” are the only ones listed. Having a separate publishing rule for each site makes analysis and reporting a little easier because each rule can be considered a ‘site’. If however, you have multiple sites published through a single rule you can use the Site Name field to differentiate between sites.
The inverse of this is when you have a single application that is published on multiple servers with multiple rules. In this case you would want to combine the rules for reporting purposes. The best way to do this is by using an Alias.
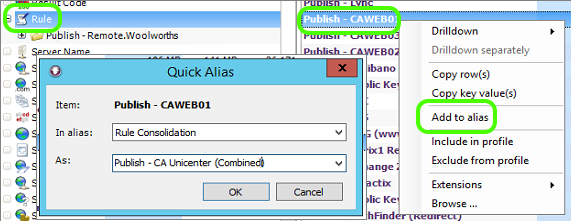
- Select the Aliases tab and click New Alias
- Name: Rule Consolidation
- Click the Scheme down arrow and select Forefront TMG Web
- Scroll down the available fields and select Rule
- Click the Right Arrow
- Click OK

Now that the Alias has been created we can define groups and add values to them. The easiest way is to simply use the Analysis we already have open.
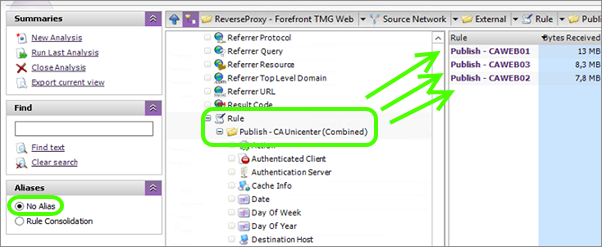
- Return to the Summaries tab and select the Rule summary
- Change the Aliases view from ‘No Alias’ to ‘Rule Consolidation‘
- Right-click the first rule you want to consolidate and select Add to Alias
- In the As: field specify the consolidated name you would like to use
- Click OK
- You will see the name change to be the same as the alias value
- Select the second rule you want to consolidate and Right-click | Add to Alias
- This time you can simply select the existing value from the drop down list
- Click OK to group the second rule into the same alias as the first.
- Repeat for all the relevant rules
This gives you a single rule for the whole application published across multiple rules or servers. The alias not only cleans up your view, but it can also be used when specifying filters and generating reports. The alias consolidates the log data, but it is still available if you want to break it up again.
Selecting the alias will trigger a drill down and from here you will be able to see the individual rules again if you change the Alias view to ‘No Alias’.
In practice you would use both methods. You may for instance want to get an overall picture of your Exchange web site usage. In many cases this would be published with a single rule, but it will contain multiple site names such as webmail, autodiscover, legacy and so on. If you want to get more details on which components are used, you would use Site Names without an alias.
Useful information for reverse proxy reports
Now that we have a method to isolate the various published web sites or applications, we can investigate the kind of information you might want to report on. In the reverse proxy scenario you typically want to know:
- Who
- What
- Where
- When
Who
Since the usernames are generally not known, you can determine who the user is by looking at the Source IP and the User Agent fields. This helps identify unique users and the device types they are using.
What
Knowing what your user base is accessing can tell you many of things about your application. The following fields will give you better insight: Site URL, MIME Type, Operation (GET, POST) and Protocol (HTTP or HTTPS).
When
Typically, this would be information requiring date and time so the fields of interest here would be Date, Day of Week and Hour.
Where
Knowing where your site’s users are coming from can be very useful, especially if you are trying to measure the effectiveness of advertising campaigns. The fields of interest here would include Referrer Domain and Referrer URL.
The ad-hoc analysis would have shown you that there are a huge number of fields available, most of them adding little or no value to reverse proxy reporting.
To consolidate things, but still give you enough information to work with, we can reduce the required summaries down to the following:
- Source IP
- User Agent
- Site URL
- Mime Type
- Operation
- Protocol
- Date
- Day of Week
- Hour
- Referrer domain
- Referrer URL
- Rule
- Site Name
Create a Reverse Proxy Report Template
Having all of the data in an analysis is great for doing a ad-hoc drill investigations, but most likely you will need the information to be reduced and condensed into an easy to digest report. Next we are going to set up a simple report template that will show the key pieces of information per site:
- Select the Reports tab and click New Template
- Specify a Name and select Forefront TMG Web as the Schema
- Report Type should be Analysis
- Click OK
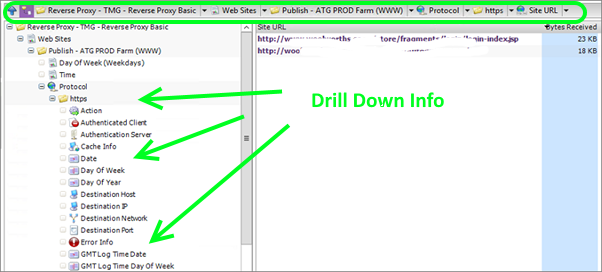
Now that a blank template has been created, we can add the fields we are interested in. The steps below add seven nodes to the template. This looks like a lot to do but it is really quick and easy. The template will also be available for download below so you can skip this step if you’re using Microsoft Forefront TMG.
- Double click the Template to edit it
- Click New Node
- Name: Web Sites
- Summary: Rule
- Alias: Rule Consolidation (created above)
- Sort by: Size
- OK
- Select the Web Sites Node and click New Node to create a sub node
- Name: Day of Week
- Summary: Day of Week
- Alias: Weekdays
- Sort By Day of Week | Ascending
- OK
- Select the Web Sites Node and click New Node to create a sub node
- Name: Time
- Summary: Hour
- Alias: Hours
- Sort By Hours | Ascending
- OK
- Select the Web Sites Node and click New Node to create a sub node
- Name: Protocol
- Summary: Protocol
- Alias: None
- Sort By Size | Descending
- OK
- Select the Web Sites Node and click New Node to create a sub node
- Name: MIME Type
- Summary: MIME Type
- Alias: None
- Sort By Size | Descending
- OK
- Select the Web Sites Node and click New Node to create a sub node
- Name: Source IP
- Summary: Source IP
- Alias: None
- Sort By Size
- Click Advanced
- Select Having for TOP N Select 25
- OK
- Select the Web Sites Node and click New Node to create a sub node
- Name: User Agent
- Summary: User Agent
- Alias: User Agents
- Sort By Size
- Click Advanced
- Select Having and for TOP N Select 25
- OK
- Select the Web Sites Node and click New Node to create a sub node
- Name: Referrer Domain
- Summary: Referrer Domain
- Alias:
- Sort By Hits
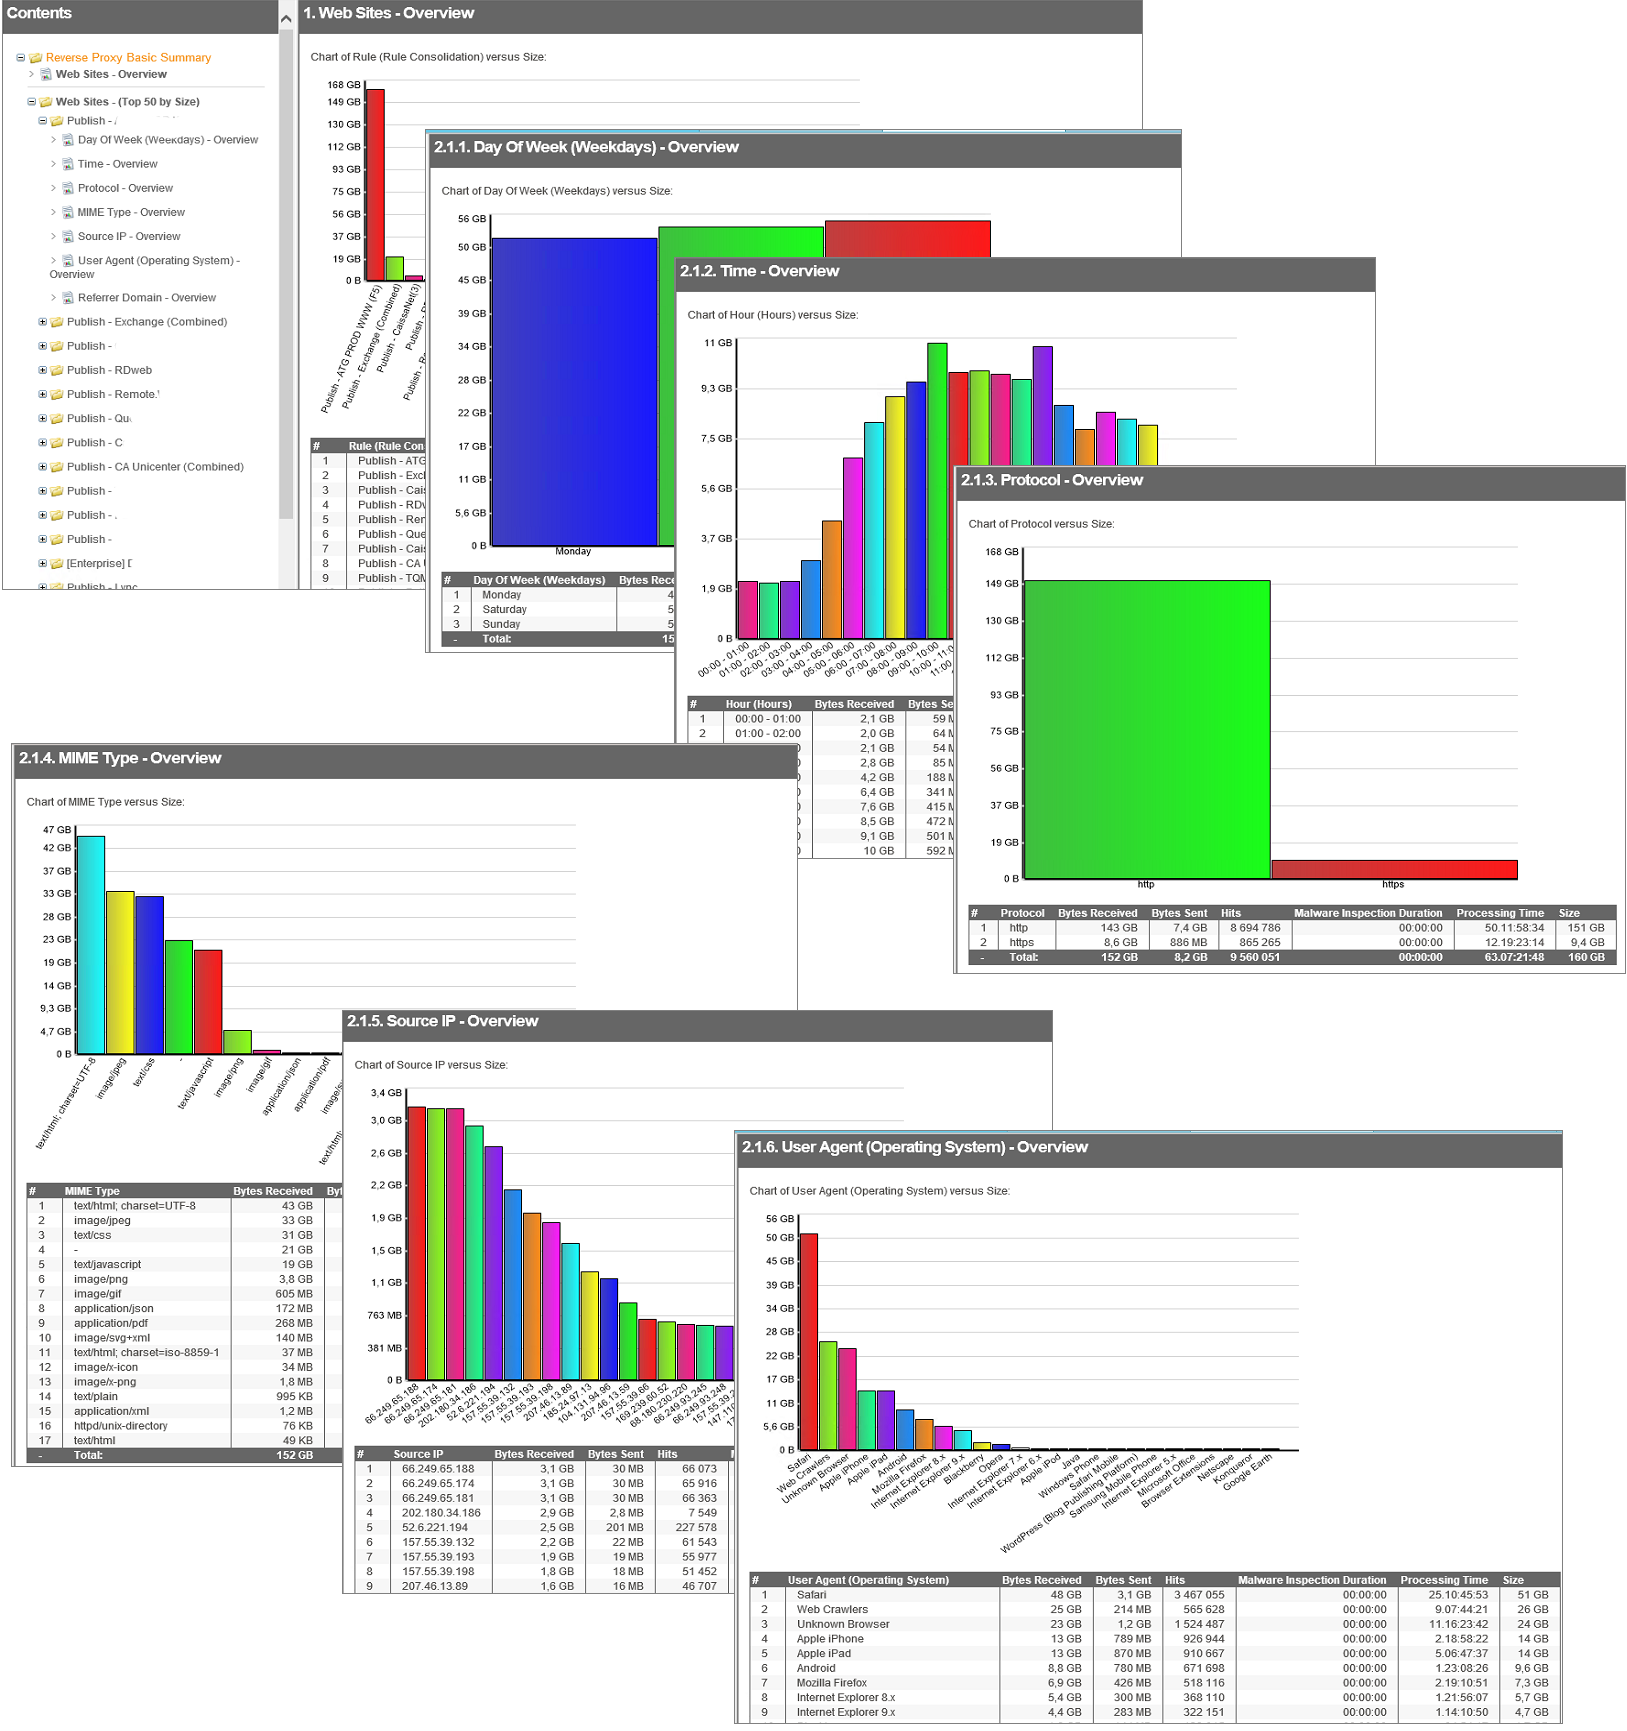
By the time you are done you should have something that looks like this:

Using the Reverse Proxy Template in an Analysis
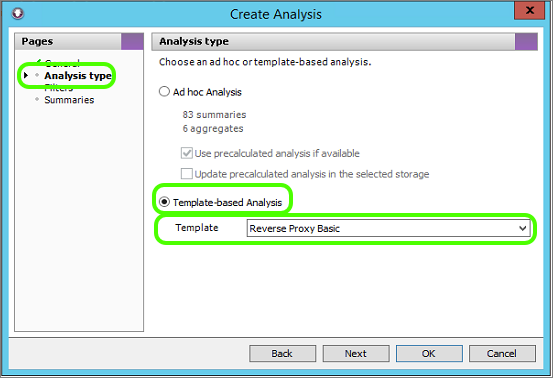
The template we created can be used to generate a report (Word, PDF, CSV etc), but the same template can also be used for doing a Summary Analysis. This is a great way to check your template structure.
- Select the Summaries tab
- Click New analysis
- Select your reverse proxy Storage
- Analysis Type : Template-based Analysis and select your new Reverse Proxy template
- Click OK to load up the Analysis
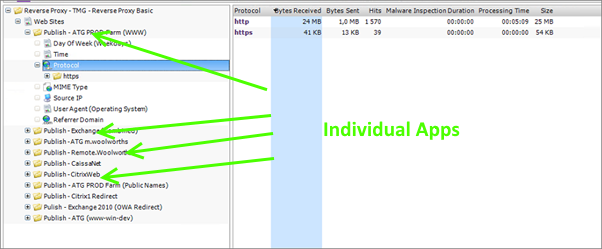
You can now browse through the Analysis and you will see that it is much cleaner to look through than the default ad-hoc analysis we ran earlier. A nice feature of the running the template on the Summaries tab as a template-based analysis, is that you can still drill down past the bounds of what you defined in the report template. For instance, you can click the http protocol to get more details on the resources not served over HTTPS.
When you click on an item to drilldown into it, all of the available summaries are displayed. Also note in the navigation bar at the top, your filters are being cumulatively applied.
Distributing Reverse Proxy Reports
Next you can generate a report in one of the many different formats available within WebSpy Vantage. These reports can then be automatically emailed out on a schedule, or could be published and made available through the web module.
- Select the Reports tab
- Locate the Reverse Proxy Template and click the Generate Report button
- Select the Storage to use
- Select a Format (Web Document, PDF, Word, CSV, or Text. I’m using Web Document)
- Publish: Specify where you want it to go
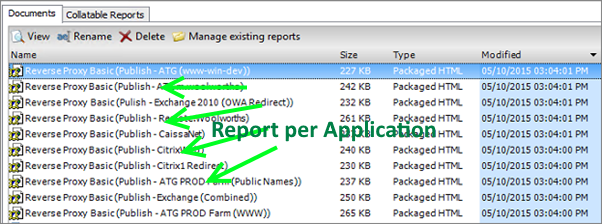
- Documents: Since I want to give each web application owner his own report, I select ‘Create a Separate report documents for each’: Rule with the Alias Rule Consolidation.
- Filter: I want to run the report on the past week, so click Add | Relative Date Filter | Last 7 Days
- Specify an email address to send all reports to (if desired)
- OK to start the report
Once the task is done you will have a separate report for each Web Application for the past week only.
The Results!
Each report contains loads of useful information. We can determine that the bulk of the site’s traffic peaks between 9 and 10 AM. The bulk of the users are connecting via Safari browsers, and the biggest external sources for users to connecting to the site are google.co.za followed by facebook.com, while only 87 hits came from pinterest.com (30th on the list).
By looking at the source IP’s, we can determine that a lot of users of the site stick around and click through multiple links and download a fair amount of content.
Applying some knowledge about the site WRT to HTTP vs HTTPS content, we can tell that a high percentage of users are actively logging in, not simply browsing without converting to actual sales.
Furthermore, because we have a holistic picture of all the sites being published, we know that this particular site consumes 70% of all the available bandwidth to the hosting site.
This level of information can be extremely useful in retail settings, but can be equally important for corporate web applications. Usage patterns can help guide you to determining the best windows for system maintenance etc.
Since reports templates are almost indefinitely customizable, you can tune them to show the exact data you are interested in.
What next?
This was an introduction on how to explore the information available to you in a reverse proxy log file. Typically you would want to import more log files into your Storage, and report across larger time frames. At this point the summary and report generation time will start to increase, but the bigger picture becomes more accurate and valuable.
You may also want to tweak your template to show just the right level of information for your report audience.
Lastly, you should automate log importing, report generation and publishing, and purging of log data older than what is required. All of this is easily accomplished via the Tasks tab in WebSpy Vantage.
I hope this basic ‘start to finish’ tutorial was helpful in not just creating a basic reverse proxy report, but also in showing you some of the awesome reporting possibilities with WebSpy Vantage.
Vantage supports log files from over 200 popular network devices, and with its comprehensive aliasing feature, is the most flexible log analysis and reporting framework you’ll find.