
In this blog we will look at the structure of report templates, and how you can use structure to report on what you want to see.
Any element within a report template is known as a node. These nodes can be set at different levels of the report template to achieve different reporting results.
Any node at the root level of the template will display data for the entire storage, depending on the filters applied to the node, the template globally or in the Report Wizard at run time.
Any node that is indented beneath another node will display only the data for each item individually from the node above it. So to get a listing of the sites visited by a user, you must add the site node at an indented level beneath the user node.
Let’s look at the structure of the Large Downloads template, which is one of the Vantage sample templates: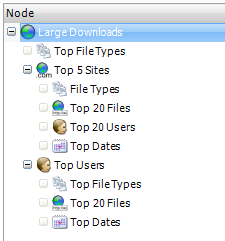
When this report is generated it will show:
(a) A table and chart of the Top File Types for the entire organization
(b) A table and chart of the Top 5 Websites for the entire organization; and then
- For each of the Top 5 Websites:
- (i) A table and chart of the File Types for that website
- (ii) A table and chart of the Top 20 Files for that website
- (iii) A table and chart of the Top 20 Users for that website
- (iv) A table and chart of the Top Dates that that website was accessed
(c) A table and chart of the Top Users for the entire organization; and then
- For each of the Top Users:
- (i) A table and chart of the Top File Types for that user
- (ii) A table and chart of the Top 20 Files for that user
- (iii) A table and chart of the Top Dates for that user
See the generated report here: Large Downloads Sample Report
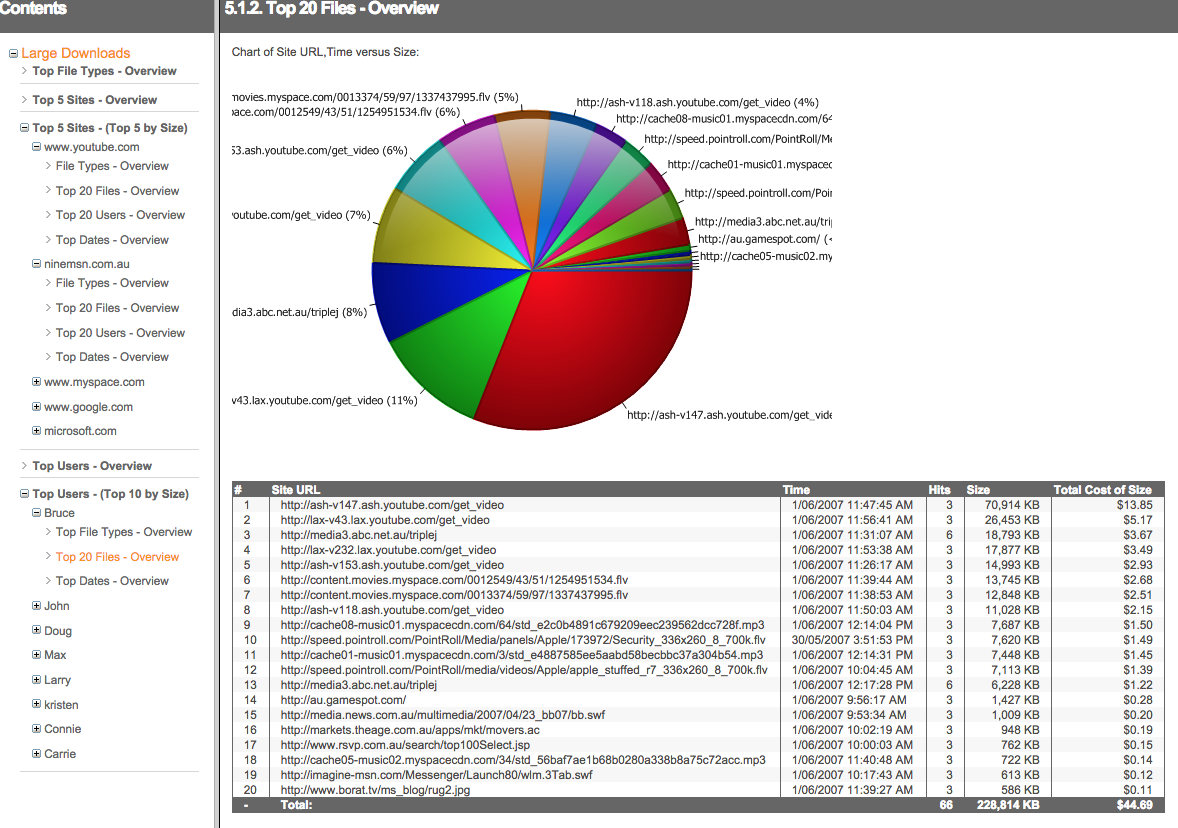
Here’s a screenshot of part C (ii) – The table and chart of the Top 20 Files for one of the users
So every node that is added to a report template can display a table and chart, which can be controlled within the node customization itself. If you wish to see the data for the node for the entire organization, then add the node at the root level, but if you wish to see the data for the node broken down by another summary, then add the node underneath the node you wish to break the data down by.
For example, in the template above, if you wanted to see a table and chart of the Hours of the Day during which data was accessed, for the entire organization, then right-click the root node of the template (Large Downloads) and choose New Node.
If you wanted to see a table and chart of the Hours of the Day during which data was accessed, for each website individually, then right-click the Top 5 Sites node in the template and choose New Node.
The nodes (a), (b) and (c) are known as Level 1 Nodes. The nodes (i), (ii), (iii) and (iv) are known as Level 2 Nodes. Level 2 Nodes are drilling down on the Level 1 Node that it is indented under, and the number of drilldowns is dictated by the number of items included in the Level 1 Node. You can have as many levels of nodes in your template structure as you need to, however each level will slow down the report template as many more drilldowns need to be calculated.
For example, if your report template has a Level 1 User node, with 10 users, then a Level 2 Site node with 20 sites, and then a Level 3 Date node, this means the report template will have to drilldown on each of 10 users to generate the top 20 sites for each user, and then drilldown on each of the 20 websites for each of the 10 users to find the dates for each site, so that would be 10 x 20 = 200 drilldowns.
Related Blogs:
Report Templates: Making The Most of Your Data
Report Templates: What Makes Up a Node?
Tips:
1. Whenever you make changes to a report template, on completion of the changes, click Return To Reports on the left, then click the Save Templates link to make a copy of your changes, before running the report.
2. When you run the report, use a test storage, with only a very small amount of data in it. This will allow the report to complete quickly, and let you see whether the changes are what you expected. If they are, then you can run the report on your entire data.
Leave A Comment